



TESLA – daily

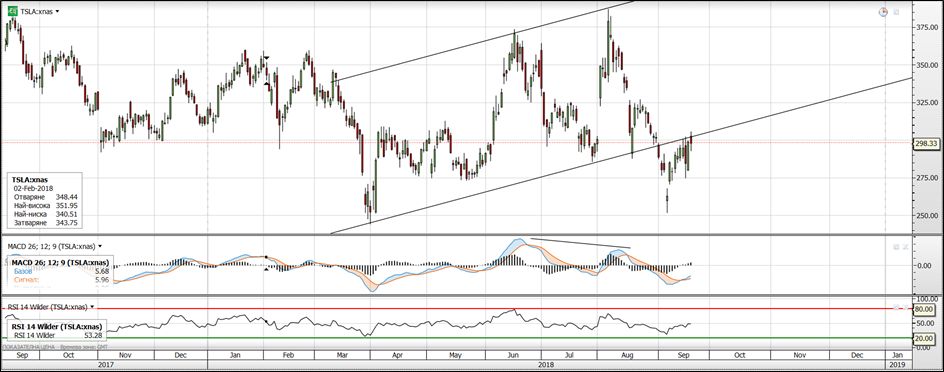
Tesla’s stock price generally fluctuates quite heavily; however the general price trend for Q2 2018 was upward. Interestingly, there was negative divergence identified in Aug 2018, where the price hit a new high, but the MACD oscillator was showing a negative trend. This indicator resulted in a sharp 26% price drop from 390 USD to about 290 USD in about 2 weeks. Musk’s announcement about taking the company private again and then the subsequent renouncement gave a short-term boost to the company market cap, but then resulted in an even sharper price drop to around 250-255 USD per share – the US DoJ is currently looking into potential market manipulation attempt.
The graph clearly shows that the price pattern has broken out of the trend channel and is now stuck at the previous support line (now acting as a resistance to the price movement). The MACD indicator is showing signs of potential uptrend recovery, but this is yet to be confirmed – the RSI tool is showing a neutral market, which means the price could go either way. The DoJ review and their announcement of the ongoing probe would be important news to follow in deciding what position to be opened.
VW – weekly

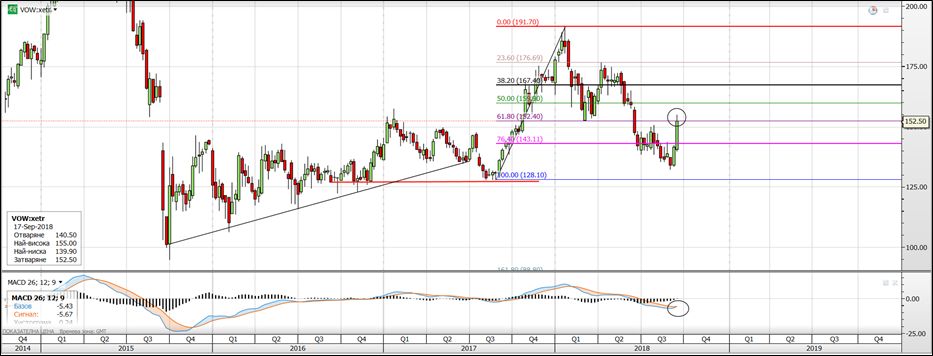
VW’s market cap started recovering after the emissions fraud scandal broke out a couple of years ago; however, in Q2 2018 the story was revisited with massive settlement payouts and more allegations coming their way. The share price is currently hovering around 152 EUR and is stuck at the 61.8% of the Fibonacci retracement of the previously positive price trend. This is a crucial resistance, as far as market sentiment and behaviour s concerned. The MACD indicator is showing signs of reversal, although one can argue a slight negative divergence forming-up at 152 EUR/share, with the indicator hitting new lows and the price on the chart actually recovering within a week. Short-term price drop can be expected, with support formed at around 143 EUR.
Facebook – daily

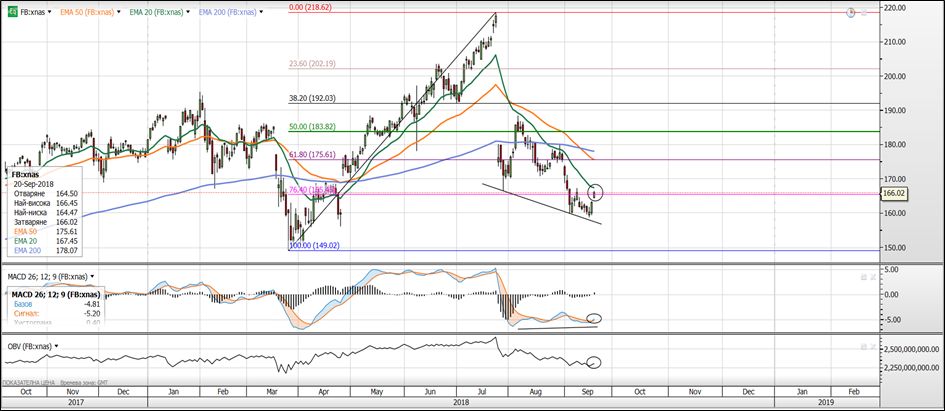
Facebook’s share price is always an interesting market phenomenon to be followed, with historical over-valuation sentiment being strongly engraved in the market. This summer, Facebook suffered a great blow to their market cap in line with the customer data breach and elections manipulation scandal, which involved a British political advisory firm (Cambridge Analitica). Facebook managed to restore some of their market cap back in Aug 2018; however, the price dropped again in Sep 2018 to below 76.4% of the Fibonacci retracement of the previously positive price trend – the price is now stuck at this important resistance, with the MACD indicator showing a positive reversal and positive divergence, which can lead to an upward trending market sentiment (target at around 175 USD/share). We do believe that a higher volume is required though (OBV chart) for the buyers to push the bears out of the scene and restore some of the company market value beyond the Fibonacci resistance of 165-166 USD – the EMA 20 is also in the way of the price recovery and is currently acting as a resistance. The current support for the price movement is at around 155 USD.
Gold/USD – daily
Resistance: 1230 USD —Support: 1165 USD

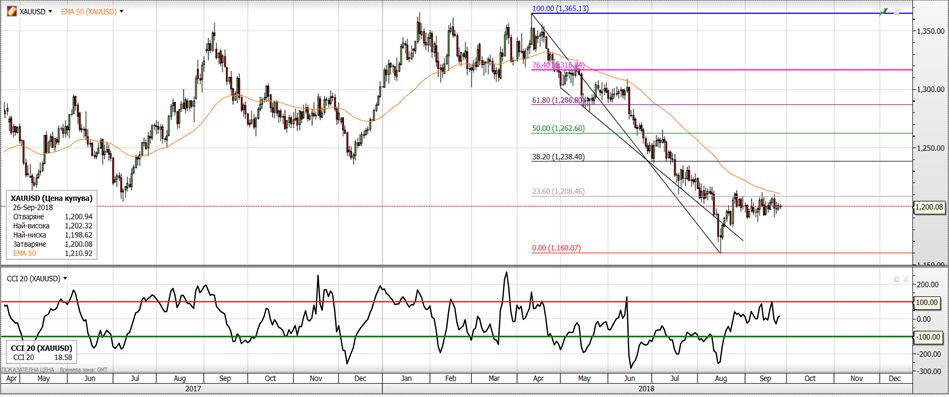
The Gold/USD pair is always in the financial markets highlights, with the safe heaven showing signs of weakness since May 2018, as the price dropped from 1365 USD/troy ounce down to 1160 USD/troy ounce (15% decline). The price started recovering in the last two months, with the US-China trade war taking hold of the markets and showing negative sentiment towards the USD value in the long-run. Currently, the price is struggling with the 23.6% of the Fibonacci retracement of the previous downtrend, with consolidation forming at the 1208 USD resistance, which is further strengthened by the EMA 50. Other key levels are the 1230 USD resistance and 1165 USD support lines, which are derived from standard pivot analysis. The CCI (commodities channel index) analysis tool is showing a fairly neutral position, with a potential buy position indication – further confirmation is required of a positive trend, but the CCI needs to break the +100 upper bound for the trend to be confirmed.
Graphs and tools source: Elana Trading
Disclaimer:
This analysis represents the personal and objective opinion of the preparer on the market and does not aim at offering any sort of market advice with regard to the discussed financial instruments. Moreover, this analysis does not aim at offering the user to transact with those financial instruments in anyway. The sole purpose of this analysis is to provide information of the financial markets and the personal opinion of the analyst.