



Gold/USD – Daily chart
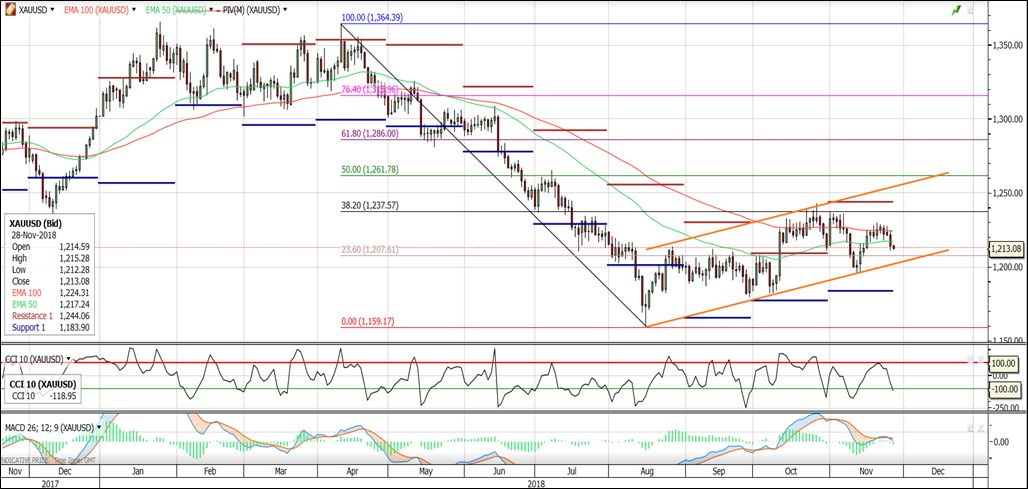
Since its last peak in April 2018 at around $1,364 for troy ounce, the USD price of Gold has taken a great hit, reaching just over $1,159 – a 15% price drop in only four months. The strengthening of the US dollar has played a crucial part in this price reduction, being the currency in which gold is mostly traded in. From the above technical analysis, we can draw several conclusions about the state and potential forward movement of the international prices of the precious metal. Firstly, the price is struggling with the resistance formed around $1,237-1,238 (38.2% of the Fibonacci retracement) – after bouncing back this major resistance line and going below the 50-day EMA the price is now struggling with the 100-day EMA, which is acting as a strong resistance to the retracement movement. The general trend since mid-August is an upward one; however, the CCI (Commodities channel index) trend indicator is breaking out below -100, which implies a negative trend. This is further supported by the MACD indicator, which is crossing the 0 line (and into the negative area) and setting up a negative formation, with the MACD line going below the signal line.
Now, we do not expect a major price correction (although further strengthening of the USD currency could surprise us) – prices should bounce back up at the bottom of the trend channel (a good long position entry point), which strength as a support line will be further supported by the $1,200 psychological milestone. Prices should bounce back and remain within the channel, with an opportunity of short-term gains, with worst case scenario stop orders at around $1,180 per troy ounce.
Corn – Daily chart
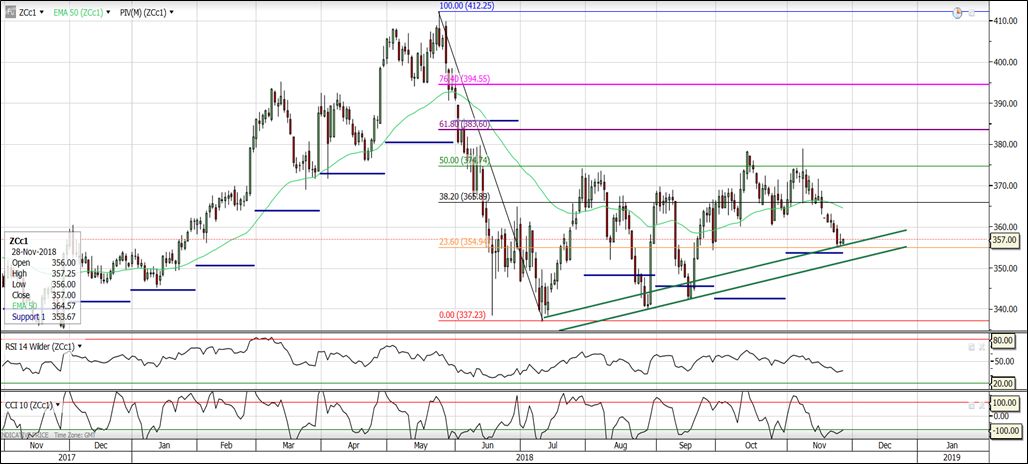
Corn prices dropped significantly (by 18.2%) between the end of May and mid-July to $337.23, which was an expected price move with the anticipation of the crop yields in August-September 2018. Since mid-July price have fluctuated quite a lot. At the moment the corn price is bouncing off the 23.6% key Fibonacci retracement level at $356. This happens to be the intersection with the upward trend line further strengthening the support at that level. The CCI indicator is showing a trend reversal and is about to beak the -100 level going upward, which usually indicates a good long position entry point. The first support level of the pivot analysis (short blue line) is also intact. The RSI oscillator is also indicating a trend reversal with a bit of caution as the oversold level (at 20%) staying intact, which implies a further price reduction potential. At the moment $350 seems like a reasonable stop order, with a general buy attitude. The 50-day EMA fluctuates aroid the 38.2% ($366) Fibonacci retracement level, which is the next big resistance per the chart. If that was broken, the next level to worry about is at $374 corresponding to the 50% stage of the Fibonacci retracement, which the Corn price struggled with (and bounced back from) in October and November of this year.
Crude oil (WTI) – Weekly chart
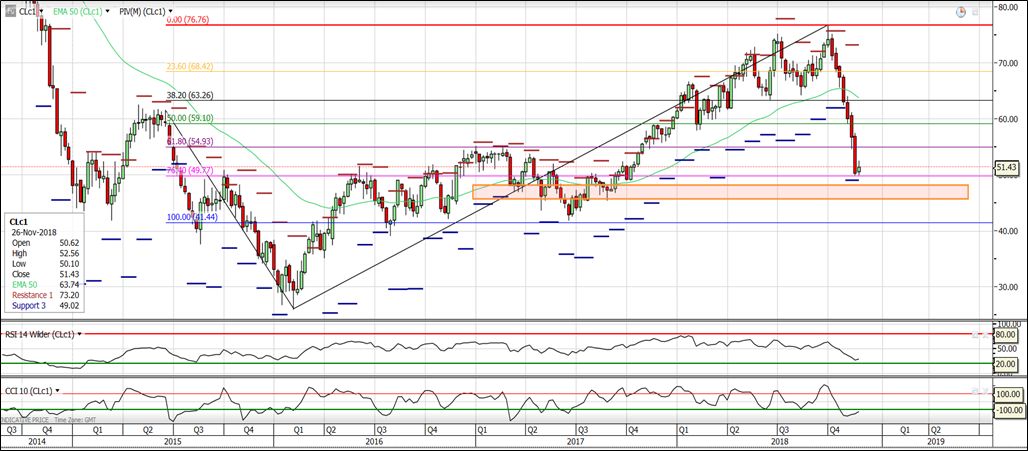
Since the lowest price level for WTI ($26 per barrel) was reached mid-Q1 2016, the prices have bounced back and gradually increased over the last couple of (with some fluctuations along the way, of course), with gains of nearly 200%. This was mainly achieved through the drilling and supply cuts introduced by OPEC and Russia in attempt to restore prices and stabilize the industry, with the US countering their efforts and increasing drilling and supply. Since the end of September 2018, though, oil prices have sharply dropped by almost a third of the September prices, down to £50 per barrel, where the price is trying to bounce back up – this level corresponds to 76.4% of the Fibonacci extension (currently acting as temporary support level), which shows the continuation potential of the previous negative price trend. The RSI index is showing a nearly oversold market with trend reversal indication, which combined with the CCI entering the above -100 level imply that a potential trend reversal is quite possible – entering a long position at the moment (net trading volumes stabilising from the sharp drop – per OBV volume indicator) should be a good call, especially in line with the fact that OPEC leaders are meeting this week to discuss the price drop, which fact alone is already sparking up the market again. The red area $46-48 is a good loss stopper location formed by previous support levels – the third support level per the pivot analysis (short blue line) at $49 is also a good stop price. Worst case scenario, if buy sentiment does not pick up and/or the OPEC meeting disappoints traders and investors, the next key support level is the $41 mark at 100% of the Fibonacci extension, which would be in line with the Q3 2016 and Q2 2017 lows. Generally, prices should bounce back a bit to at least $55 per barrel, but the price will still have a long way back to Q3 2018 highs of $76-77 per barrel.
Graphs and tools source: Elana Trading
Disclaimer:
This analysis represents the personal and objective opinion of the preparer on the market and does not aim at offering any sort of market advice with regard to the discussed financial instruments. Moreover, this analysis does not aim at offering the user to transact with those financial instruments in anyway. The sole purpose of this analysis is to provide information of the financial markets and the personal opinion of the analyst.
Bulgaria is a great location for setting up physical and/or speculative commodities trading office. The country has good agricultural landscape, with ideal weather conditions and perfect soil structure, yielding strong crop harvest. Bulgaria has several gold mines operated by international mining companies, with several identified untapped gold fields. Furthermore, oil and gas explorations are currently in underway in Bulgaria’s territorial waters in the Black Sea. Having the one of the lowest corporation tax rates in the EU, offering adequate real estates at undervalued prices, allowing for operating a business at very reasonable overhead costs, and offering highly skilled, efficient and affordable workforce, Bulgaria is the ideal place to branch out your company to or even establish a new business and set up a brand-new company. Now is the time to be smart and efficient about expanding your business or turning the next great commercial idea into a profitable business. Bulgaria, as one of the fastest growing and most strategically located markets in the EU, is the best place to be right now – the government is offering great tax and infrastructure incentives, with a lot more to come, to all new investors.
Interested in registering a company in Bulgaria or need help and support running it?
Checkout our company registration, management and support services